Measuring boat speed - KS3 engineering
Time the journeys of different shaped boats and present the results
This engaging engineering activity for KS3 considers displaying data from a practical investigation looking at the effect of streamlining a boats hull.
Students will be asked to consider how this information can be represented effectively and use this to form conclusions. The reliability of their results will then be discussed.
Activity Measuring boat speed
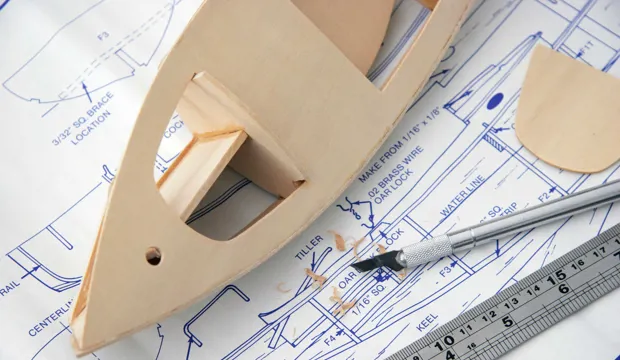
Students will use the test rig, which can be found in the resources below, to test several different shaped boats. Students should measure the time taken for each boat to travel a set distance and record the results.
Ask the students to discuss the fact that there is no measurable independent variable as it is very difficult to quantify the hull shape in terms of numbers.
The students should ponder how they are going to represent these results graphically.
If time is available, complete the investigation by repeating the tests. Discuss the sorts of errors that might occur in the collection of results.
Learners will then plot their results into a bar graph. This could be used as part of an advertising campaign to sell the boat which could include design, bar chart, a brief conclusion and an explanation as to why the results are reliable.
There is also an opportunity to use data logging equipment as well as light gates to further reduce errors in this engineering activity.
As an extension, students could calculate speed (s=d/t), and the mean speed for each boat, taking into account the anomalous results.
Students could consider what they could measure to draw a line graph and find the optimal hull design. If time is available, students could manufacture and test their own designs and include them within the analysis.
How long will this activity take?
This activity will take approximately 45 minutes.
Tools/resources required
The construction is a fairly simple activity and can be undertaken by your KS3 students (as an after school activity or by a technician)
- Boat objects
- Stop Watch
- Graph Paper
Suggested learning outcomes
By the end of this activity students will be able to explain when to use a bar chart and when they should be used to display categoric variables, they will be able to evaluate an experiment in terms of its reliability and precision and they will be able to apply scientific and mathematical understanding to an engineering context.
Download the free Measuring boat speed activity sheet below!
All activity sheets, worksheets and supporting resources are free to download, and all the documents are fully editable, so you can tailor them to your students’ and your schools’ needs.
The activity sheet includes teacher notes, guidance, useful web links, and links (where appropriate) to the national curriculum in each of the four devolved UK nations; England, Northern Ireland, Scotland and Wales.
Please share your classroom learning highlights with us @IETeducation.